C5 Intro to Google analytics
Download PDF Version
1. Introduction
You may be aware that our system provides a weekly report showing some excellent top line data for your website traffic. This can be seen by going to the admin system and clicking on Site management Stats. There is a weekly summary of the three most important statistics relating to your website traffic, namely.
Pages (“Hits”). The number of clicks made while people have been on your site.
Users. The number of different people who have visited your site.
Visits. This is the number of times your site has been viewed, eg if someone visits your website twice, they show as 2 visits but only 1 user.
Should you require more detailed information, however, our system can also hook up your site to Google Analytics, one of the leading website analytics solutions available. It's free, easy to set-up and has a huge range of features that go way beyond the simple traffic overview. So many in fact, it can be a bit overwhelming when you first look at your stats – but given the importance of understanding how your website is used, it’s definitely worth exploring. This guide covers integrating Google Analytics with your site and briefly runs through what some of the information means.
2. Setting up a Google Analytics account
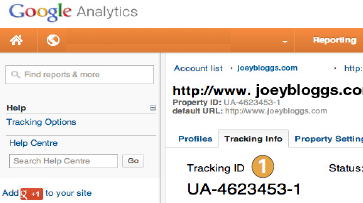
The first step in integrating Google Analytics is to request an account. Just visit http://www.google.com/analytics to get started. You may have a Google Account already if you use Google Reader or Gmail, but if you don't, click on the Sign Up button in the grey box Enter your details as prompted, including which site you would like to track Click on the blue button at the bottom Get tracking id and take a note of your Tracking id code.
3. Linking up in your admin system
You now need to add your Google Tracking ID code in your website admin system. Click on Site management Google Integration Copy the code into the Google Analytics ID field Submit And crucially, click on Make live.
4. Now wait...
Google Analytics usually takes a few hours to pick up that your tracking ID has been put on your site, and it won't show any data until the day after. Even then, it only becomes really useful after a few weeks of collecting data. To test the set-up go onto your live website and click around, visiting several pages. This will ensure that Google has some preliminary data to collect. You can then log in the next day to see if it has appeared. You can later instruct Google to remove your visits from its data so that you only see visits from other people (this can be a bit tricky to set up, but there are lots of tutorials on the internet to show you how).
5. Viewing your data
Just log in to Google Analytics and click on All web site data. You will see a report page like the one we show in 7. below. Browse around to see what sort of data is available – quite a remarkable array of information! It can be a bit overwhelming at first, so we have provided an explanation of the most important things to look out for in 7. below.
6. If you would like to go further
For most users, this should provide more than enough information. However, if you wish to dig deeper – and/or try some advertising with Google – why not browse the Google Analytics section and/or do some searches on the internet for more advice and guidance.
7. Summary of key information
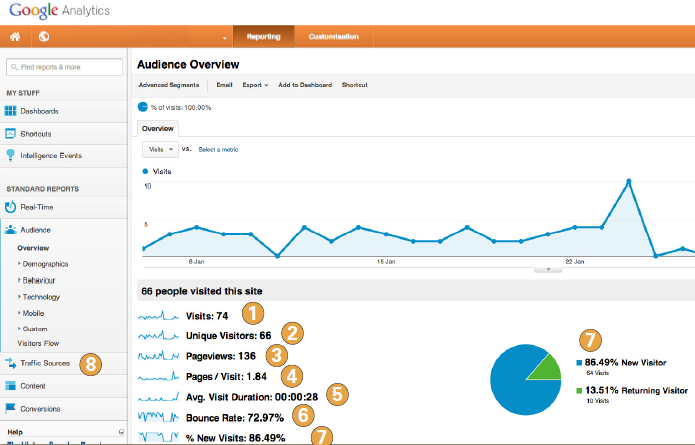
qVisits. The number of visitors you have on your site each day. If one user goes on your site twice in one day, then it counts as 2 visits.
wUnique Visitors. These are users who have come on your site in the last 30 days. Even if they visit 20 times, they still count as one Unique Visitor. A useful figure for seeing how many different people visit.
ePageviews. How many pages on your site have been viewed. If a visitor looks at 5 different pages on your site, this would be 5.
rPages / Visit. A very useful figure, it’s simply Pageviews divided by Visits. So if you have a figure of 10, most of your users are seeing 10 pages. This figure would be lower if you use carousels that display each gallery’s photos all on one page.
tAvg. Visit Duration. The average length of time each visitor spends on your site.
yBounce Rate. Basically, if a visitor comes on your site and leaves without looking at any other pages, this is a “bounce”. So the lower this figure, the better your site would appear to be performing. That said, it may be your intent that they only look at one page, eg for contact details, or your site may not be designed or intended for multi page views. Historically, bounce rates have also included search engine indexers to add further confusion. Still, it’s worth trying to get this figure down as low as you can.
u% New Visits. A low figure says that a lot of your visitors are people coming back to your site, while a high figure says that lots of different people use your site, but don't come back.
iTraffic sources. This section provides particularly useful information as it tells you where your visitors came from – broken down by direct traffic, search engines, etc. It even tells you which search phrases were used when people looked for your site. Definitely worth browsing around!
